Breakthrough in applied hydrogeology after fifty years of research
Уважаемый Исаак Сокол. Shalom.
Это моё обращение к Вам имеет необычный характер. Это просьба о помощи в моей попытке привлечь внимание возможных спонсоров или компании для передачи им моей разработки на корню в собственность. Я прошу Вас поместить на сайте ЭНС мою статью (присоединена) на английском языке объёмом 990 КБ достаточно популярного по форме текста с графиками. Мне нужен линк, который я смог бы пересылать для ознакомления с сутью разработанной технологии. Если Вас интересует причина для такой интриги, текст ниже её раскроет. Но если жаль времени, можете этот текст проигнорировать. Но просьба остаётся. Буду благодарен за содействие и хорошее отношение.
С наилучшими пожеланиями,
Исаак Гершанович, проф.
Пояснение
В 2007 году я создал стартап, который пришлось закрыть в 2008 году из-за кризиса. А в примерно 2010-м у меня вдруг прорезалось, начался творческий бум, родилось новое поколение методологии, отвергнувшее предыдущее, ещё не успевшее дойти до рынка. Мне тогда было за 75. Я уже не мог рассчитывать на новое спонсорство и продолжал своё дело по инерции. И очень успешно с точки зрения науки. Теперь мне 87+, я завершил R&D, но не могу создать продукта для рынка (ПО пользователя). Для этого нужен спонсор и не бедный. Нет у меня финансового поводыря как партнёра. Был бы, было бы проще и надёжнее. А так приходится самому биться об лёд как рыбе в пруду. Своих финансов у меня для этого нет. И жизненного времени нет тоже. Это объективно.
Что же я всё-таки предпринимал? Я обращался через интернет к научной и коммерческой части общества в сегменте моих научных интересов, а именно, гидрогеологии и нефтяной геологии. Но эти мои обращения оказались напрасными. На сайтах целевых компаний даётся окно для кратких сообщений или адрес для коммерческих предложений. Я обращался через такие окна и адреса, но, видимо, они ушли в мусор как априори не заслуживающее внимания. Это, конечно, предположение. Был бы у меня профессиональный промоутер было бы иначе. Я все же хочу достучаться. И вот в этом я прошу вашей помощи. Для тех читателей ЭНС, которые захотят прочитать эту статью, нет никаких проблем с переводом через Гугл транслейт. Вполне читабельно.
Эта пионерская идея и её разработка прошли через всю мою жизнь как увлекательное и полное приключений путешествие в незнаемое. Каждый новый шаг требовал найти ему новое решение как открытие. Последнее по времени, замыкающее систему, абсолютно новое, открылось вдруг, как озарение, на 88-м году жизни, после почти десяти лет вынашивания этого «плода». В таких случаях восклицают «эврика». Метафорически говоря, созданы корни и ствол ветвистого плодоносящего дерева на до этого бесплодной почве. Я лично получил удовлетворение от этого моего научного увлечения, которое в Израиле, увы, произрастало как моё хобби, не без надежды на коммерческий успех. Осталось создать продукт ПО для пользователя. Демоверсия есть и неплохо себя чувствует. Но она предыдущего поколения. А я мысленно уже в будущем, ветвистом. Это моя последняя попытка. Я мир не виню. Он такой какой есть. Просто я в нем оказался белой вороной.
Прорыв в прикладной гидрогеологии после пятидесяти лет исследований
Isaak Mark Gershanovich, D.Sc. in Hydrogeology
Independent researcher, on retirement
About the author Isaak Mark Gershanovich,
Tel-Aviv, Aplaton Str., 4, 68069. Email:[email protected]
Phone: 03-6594929; Mobile: 0542584576
D.Sc. in Hydrogeology (1980); Ph.D. in Geophysics (1965)
Independent researcher, Tel-Aviv, Israel
Work in the USSR until 1991: All-Union Scientific Research Institute of Hydrogeology and Engineering Geology (VSEGINGEO), Moscow
Professor at the Institute for Advanced Studies of Engineers of the Ministry of Geology of the USSR (1983-1990). Professor at the Moscow Geological Exploration Institute (1988-1989). Expert of State Commission for Mineral Reserves of the USSR (1972-1990). Member of the Academic Council for awarding the degrees of doctor (D.Sc.) and candidate (PhD) of sciences (1981-1990).
Jobs in Israel since 1992 as freelancer with: Water Planning for Israel (TAHAL). National Water Co of Israel (Mekorot), Natural Resources Development (NRD), Ltd. and few others.
Breakthrough in applied hydrogeology after fifty years of research
Abstract
The innovative methodology of pumping well data analyzing is the invention presented herein. Its purpose is to upgrade and enrich the knowledge on aquifers and oil stratums at the pumping well affect area. The important feature is that the routine data on pumping well are in use only.
The key point of the invention is the idea to adapt the laws of variable mass motion to inflow into the pumping well. As the consequence of this innovation there was developed a method of virtual fragmentation of depression cone area into hydraulic fragments of different modes of water release. Many others additional novelties were introduced along the way. Among them the interpretation procedure of the drawdown and recovering functions is performed mutually as they are interdependent functions. Important feature of the methodology is that the missing part of the test data can be reconstructed virtually via theoretic means.
Fundamental solutions of Theis - Cooper - Jacob are retained as the template accepted nowadays in underground hydrodynamics. All restrictions to apply them are considered and overcome by the means of this innovative methodology by default in any geological reality.
Few words from the history
Dear colleagues, hydrogeologists, and petroleum geologists, this article informs you on the newest methodology in your field. It allows analyzing of the routine data of a well (exploration or extraction) to estimate the hydraulic and hydrodynamic parameters and features of the target horizon (deposit) and the environment, and the well's vicinity. The difference from the existing methodology is that it involves the inflow function into a well as a part of the analytics under the laws of variable mass motion.
Historically, I was the fourth person in the world which applied laws of variable mass motion to a pumping well. And the first researcher who targeted to get a full set of hydrodynamic and hydraulic information on aquifers and the borehole's vicinity on this path. For many years up to now I find myself a lone researcher in this direction. The promotion of this idea was comprising of theoretical, laboratory and field studies. Experimental research has included pumping with additional logging with a flow meter. This integrated research was also the author's novation. As the result, the methodology that uses a routine data of a lone pumping well only has got the desired view. After years of analytical research and properly testing it has been approved by Mekorot (Israel water company) that partially sponsored the pilot version of the software. My attempts to attract partners as voluntaries to develop the user software (next after the pilot version) has been unsuccessful.
My page at the LinkedIn website is actively visiting. I think it is due to the pilot version which has got information on. This fact says that this topic is of interest to many hydrogeologists and experts in this field. It is quite understood. The modern knowledge in this field of hydrodynamics was laid in the middle of the last century. It is time to upgrade them. The visitors hope to see the user's software. Alas, no such product for them yet. In 2007 the venture company BHCO (Swiss) has sponsored the startup to develop the user software. The first version was shown at the International Exhibition Watec in Tel-Aviv, 2007, and at the International Symposium on Groundwater in Istanbul, 2008. Unfortunately, the global crisis of 2008 forced the sponsor to abandon all his projects. I continued this development independently, but my personal bank account was too small for such project. A breakthrough in a science does not depend on the budget, it depends on the person who will appear with the interest to the problem to solve it. I turned out to be such a man. Many years ago. The further promotion needs money. Significant money. I was unable to attract them. I am missing such a talent.
I began this search in the mid of 70-ths of the past century without any reference points, by trial and errors, without any assumptions when and what should be the finish line. Only the Theis' solution on the start. It is the “home port” for subsurface hydrodynamics and various methods based on it. All they use observation wells as technological component of the test. All these methods are not appropriating my interest. My goal was to bring the Theis' solution applicable to a lone pumping well and fully matchable to any reality. It was a revolutionary idea with the zero prehistory. Therefore, I have no references of before going researchers with such a goal. I took up this problem at my own peril and risk. Few believed in this crazy idea. But the result is that the innovative methodology is ready and contents the following: "The set of routine data at a lonely well is a sufficient resource for evaluation a complete set of hydrodynamic and hydraulic properties of aquifer, its interaction with environment as a source for replenishment of withdrawal, areas to protect groundwater against pollution from the surface, and the features of the wellbore zone. All this to upgrade water resources management". This methodology intends for various types of lithology and reservoirs, well conditions in both hydrogeology and petroleum geology. The last needs some adapt and trial but theoretically it is the same.
Introduction.
The author was passionate on development an alternative methodology for analyzing of pumping well data with the aim of determining hydraulic and hydrodynamic properties of reservoirs. Aquifers were standing closer to the author's basic education and experience therefore the science interest and research were focused to these objects. The application of the obtained result to the oil-bearing objects can be as consequence of that. It is the author's conclusion. Theoretically quite probable. Under the term “alternative methodology” one should mean a new methodology for interpreting conventional transient hydrodynamic processes at a production well. They are initiated by the operator as the hydrodynamic test or are arising because of various activities on the well. For example, due to intermittent schedule of pumping ON and OFF due to various reasons. Also, archives of field data may be used for the same aim. These tests and measurements in the past can be called a treasure for reinterpretation with a new aim.
The fundamental solution of Thies [1935] and its simplified version by Cooper and Jacob [1946] are the basic template for evaluation permeable formations through data of pumping well test as a lone well or with a set of observation wells as piezometers. They are widely used since the mid of 40-s of the last century. The main requirement to use is that the test site should match the basic physical model of Theis-Cooper-Jacob solution. The local conditions at the well site, the aquifer penetration model, and mode of inflow at the depression cone area may have different discrepancies with the basic model. These discrepancies to the fundamental model have initiated development of several technologies of hydrodynamic testing, in which one or another of the restrictions could be overcome. But the basic restrictions declared in the theoretical model remained without changing. Following this principle, all known methods were developed under the aim to match with features of the object in the specific circumstances. Correspondently the explorer should pick a method which matches features of the object. For example: geometry of reservoir, leaky aquifer, unconfined aquifer, and few other. A complete collection of known techniques can be found in Sindalovsky’s handbook [2006]. There were also suggestions of methods which only hypothetically satisfying the initial requirements. A good known example is the Horner's method, commonly used for interpretation the pressure/level recovery curve in a well. Strictly speaking, it is valid under the following conditions: the aquifer/layer is confined; top and bottom are impermeable; the aquifer/layer is an infinite in the plan; the sediments/rocks satisfy Hooke's law; and the entire thickness of the reservoir is open by the well from the top to the bottom. There is no chance to meet such ideal conditions in the nature. Failure to perform at least one of the listed conditions leads to an error in the result, in this case, is the conductivity.
This article has no purpose to analyze these methods more comprehensively. Therefore, I will quote the Walton's [1983] conclusion to end this introduction. “Diverse results and vexations will arise if attempts are made to force the application of formulas to aquifer situations differing greatly from ideal conditions”. Following his statement, we can conclude that all applied methods do not provide a complete assessment of the object through known hydrodynamic tests, and the parameters and characteristics that are formally calculated, do not have an enough accuracy. This is a direct consequence of the Walton’s analysis. The proposed method herein reduces this uncertainty due to recognizing the hydraulically homogeneous area around the pumping well through the test data or data of transient period at the production well and yields the results that are pertaining to it.
This innovative methodology, compare to the modern state, determines:
* Full set of hydrodynamic and hydraulic properties of the target interval and its environment for different modes of water (oil) release,
* Hydraulic type and interconnection to the neighboring sediments or surface,
* Estimates of potential replenishment or depleting,
* Sanitary protection area for planning,
* Hydraulic features of near-wellbore zone as an operating construction.
Also, noteworthy the ability to evaluate deep horizons which commonly lack of data due to large cost of modern methods.
Prospective application for this methodology looks as following:
* To reinterpret old wells data that are stored in archives to create unified database over the world for different purposes like modeling, forecast, planning to ensure the effective management.
*To modify the concept of math modeling. Now it is a virtualization of the object's properties as the reason to the observed effect. And the opposite approach is also possible: the virtualization of the response on the natural properties and features of the object. The combination is a path to the reliability of intellectual modeling and a path to ensure the effective management.
*Parametrically monitoring of operating wells online. Any change in the operating mode of the well is accompanied by a transient process. This is quite enough to compute the hydraulic state of the near-wellbore zone and environment.
These accomplishments allow to claim the developed methodology is a breakthrough in applied hydrogeology and petroleum geology. New abilities superior the capabilities of the methods that are currently in use.
This methodology was developed via theoretical, lab, and field investigations comprised of pumping with supplemental logging by flowmeter. This integrated technology was the author's pioneer design. On the beta stage the pilot software was created to check and verify the result. The Mekorot’s endorsement is available.
This article was written intentionally in an easy-to-read manner like talking Tet-a-Tet with the potential user to reach maximum understanding the benefit of this methodology to him. Also, I hope that someone of them will be interested in complicity and promoting it as his own business around the world. Therefore, I did not load in the article even a single formula and reveal no one theoretical approach or solution. Only the road map and result. The expert is enough of that. His own experience to believe or unbelieve the result that has included herein is also sufficient. The expert's competence has a priority against the academism in this case. I think this is more important to him. So that is.
Alternative knowledge
One should believe the reader is quite familiar with the ability of all modern methods of aquifer tests for parametric evaluation these objects. Therefore, let us demonstrate the capabilities of the developed methodology right now. The report for the user of the software (when it will appear) will comprise of two parts or more optionally. First part presents the full set of hydrodynamic parameters and characteristics for three modes of water release (filtration) which are presenting in a space of depression cone at the time of pumping. They are printed like a single table or several separate tables. Modes of filtration have an identification symbolic. For elastic mode it is (j), for elastic-gravitational mode it is (jg), and for gravitational mode it is (g). Each table form has three columns for three aquifer's nominations. They have got the same definitions to be clarity to the user.
Table 1. Report, part 1. Hydrodynamic features
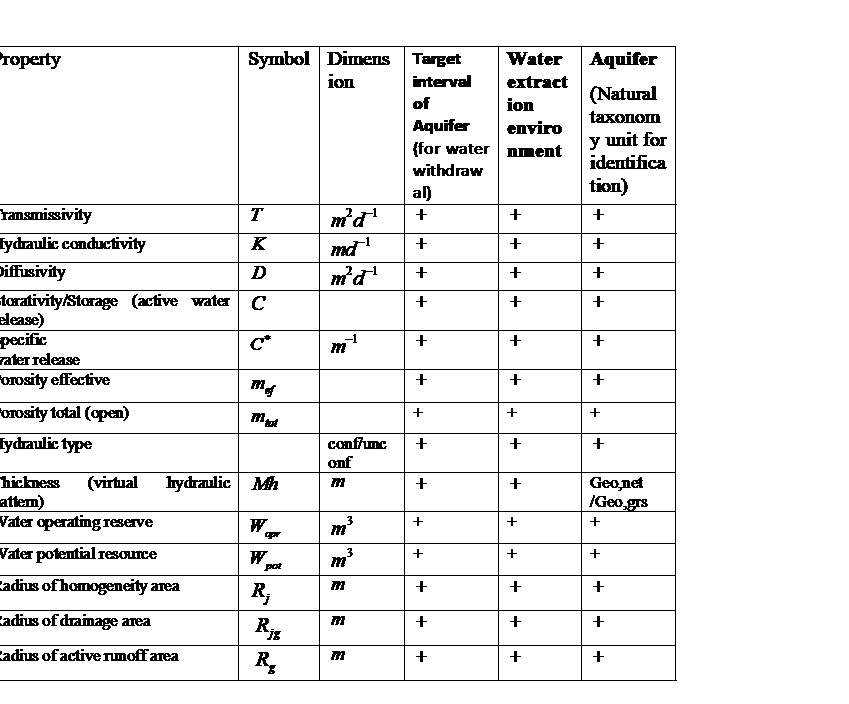
1. The Target Interval of aquifer is a filter packed interval of the well for groundwater withdrawal or open hole section for the same aim. Its length is accepted equal the distance from the top to the bottom of the filter independently if it screened sectionally or not or the length of open hole section.
2. The Water Extraction (release) environment is a composition of the Target interval of the aquifer and water saturated environment including leakage from external sources if available and have affected by pumping. It assesses and presents via terms of hydrodynamic parameters, which is convenient for comparison.
3. The Aquifer (Natural taxonomy unit for identification). It is a natural geological structure that is locally or globally hydro geologically identified by stratigraphic, lithological, or morphological features.
4. The Water Replenishment environment. This source of water intake is the water-saturated environment outside the Target interval of the aquifer. It presents in a separate table like other.
5. The Outer Source of water replenishment. The External source of water replenishment of the aquifer during pumping is a water-saturated environment outside the Aquifer as whole. It presents in a separate table like other.
6. The Porosity total (open). This is a nature property of a rock's matrix. The last investigation allowed to find a method, withing the methodology, for estimating this property in situ as average figure for Gross, Net thickness of Aquifer and for each layer composing the Aquifer. It is of important for oil containing sediments especially and some technologies of useful mineral intake from underground.
7. The Hydraulic type of the aquifer identifies here with use real data of pumping test. The fact of aquifer-surface interaction along pumping is important for designing sanitary protection measures of the aquifer against contamination if needs.
Table 2. Report, part 2. Hydraulic features of the well, filter and its vicinity
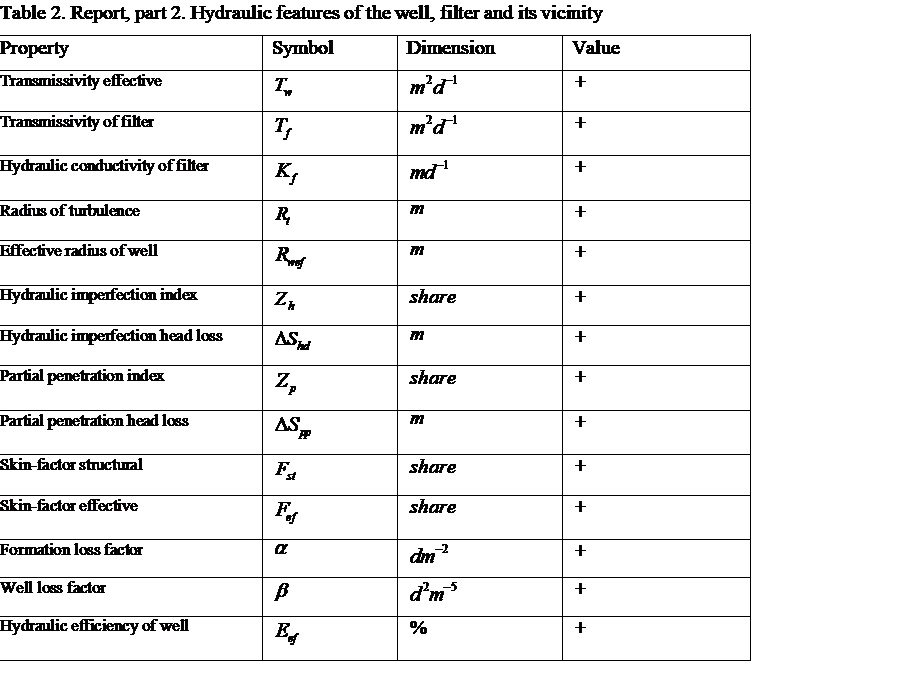
Note 1. Of course, it may seem that such report is overloaded with information, unnecessary for hydrogeologist engaged in some narrow segment of hydrogeology. Big cake always may be divided into parts. As required. This is the task of programming - the configuration of the report on request by the user. This comprehensive report will be kept on the file for another project with other need for information, without having to repeat the work physically.
Note 2. The pilot version of the software was developed for research aims only and was not intended for commercial use. The one who wants to see its result please scroll down. As the practice shows the number of exploration wells and running wells grows over the globe. Now we have a development that opens the eays of the designer and executors in any point of the globe. The customer version of the software is waiting of its developer.
Alternative Technology
What the technology is being offered and which is becoming unnecessary? The Fig.1. and Fig.2. show this clearly. A network of observation wells to monitor the water level dynamics at time of pumping and after it is no longer necessary. Only data on the pumping well are in use.

Fig.1. A piezometric well is now redundant
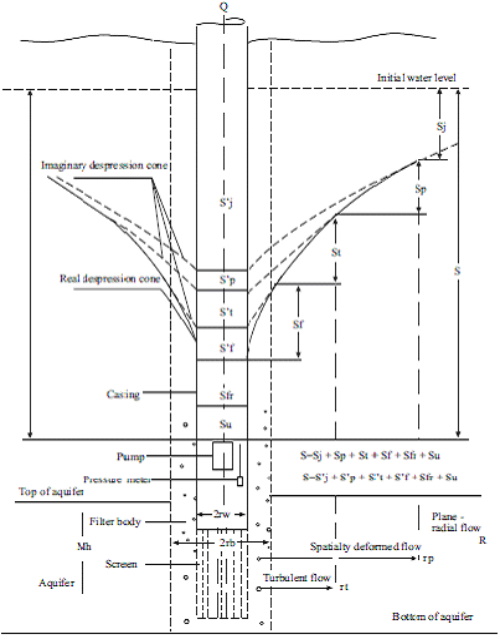
Fig.2. Schematic hydraulic model of a well-reservoir system.
This is the basic model. Inside the figure there are shown the balance equations of pressure loss on the various virtual fragments of the depression.
The following figures show other possible sources of data. All of them provide the same result by completeness.
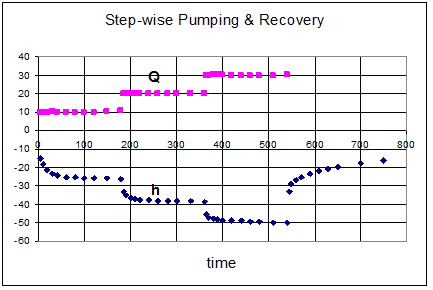
Fig.3. Multi rate pumping & Recovery test.
Such test is accepted as a full version of the test. It allows also to identify qualitative features of the aquifer except quantitative estimates. This technological model comprises of after going models as separate technologies of tests or monitoring cases (remotely, visiting, or archive diving). Every data record of transient is suitable.

Fig.4. Constant rate pumping & Recovery test.
This is a basic version also. This technology consists of transitional period of water level lowering after the pumping ON at the specified rate, and the recovery of water level after the pumping OFF.
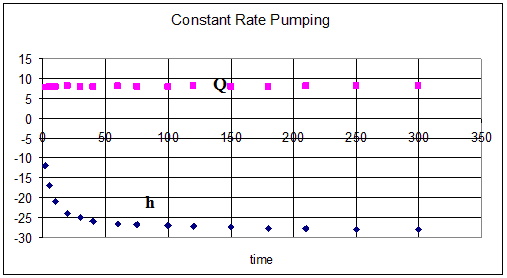
Fig.5. Constant rate pumping test (transition period at the beginning).
This version of the technology can be observed as a transitional process at a production well after the pumping ON. The missing data for recovery are reproduced virtually via new theoretical findings. All other, including result, is the same as in the basic version.
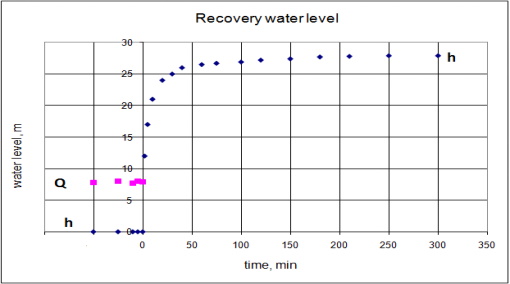
Fig.6. Recovery of water level after long-term pumping.
This version of the technology may be available at a production well which was running for a long time. Every case the pumping is stopped for any reason gives the opportunity to get data for calculation. Data that are missing in the test are reproduced virtually via new theoretical findings. All other, including result, is the same as in the basic version.
Important comment
The technology of pumping test requires draining the pumped-out water beyond the border of its possible seepage back into the tested aquifer. For this, should be used available artificial or natural means. If the back seepage becomes noticeable the pumping should be stopped. In this case the recovery curve becomes unusable. The method of virtual reproduction of its features will be just in place. Moreover. The algorithm uses this method in any case for verification of the actual recovery curve. As for reliability of virtualization itself, this issue in this development was solved theoretically and verified by practical observations. Contrary to the common opinion about the priority of using the recovery curve, we put in the first place just the curve of the level lowering during pumping. Among other things, this allows to reduce the duration of the test if there no additional tasks in. One way or another, the presence of different solutions allows the researcher to choose the most suitable one in specific conditions.
How is it become possible?
The fundamental Theis' solution is kept as the hydrodynamic template. But unlike known approaches the restrictions of this fundamental solution are not ignored here in. The clue to overcome this discrepancy was found through consideration of well-aquifer hydrodynamic system as a self-regulating system. As a closed physical system, it has steady laws and relationships that govern it. These laws and relationships have been discovered and introduced into the solution. Few of them are:
- The inflow function into a well was expressed as a function of variable mass motion.
- The forces acting in inner and outer spaces of the pumping well were 'bridged' via introduction of a new variable named "filtration viscosity".
- Virtual fragmentation of depression come into different modes of filtration became possible due to theoretical means.
- Virtual reconstruction of drawdown and recovery functions one via another in the case the Theis’ restrictions are available.
- Joint interpretation of drawdown and recovery functions as a single combined function.
- Formation loss factor is determined through data for single step of water level lowering or recovery.
These are only a part of the theoretical novelties. The algorithm is analyzing the initial field data and adapts them to the Theis’ model which is the recognizable template. Also, lithology and well design data are used as supplementary features of the object.
Advantages.
The advantages of this new method are:
- The method uses routine data of pumping rate and water level inside the pumping well.
- The data for pumping period and after it turns off are processing jointly.
- The method is applicable to any geological environment, type of reservoir, hydraulic type of aquifer, etc.
- The method is independent on the well’s depth and well’s diameter.
Additional advantages are following:
The method defines and evaluates parametrically (qualitatively and quantitatively):
(a) Target segment of aquifer where the screen installed.
(b) Environment that supplies water to the well screen.
(c) Aquifer as whole as the identification unit.
(d) Hydraulic type of aquifer in regards of interaction with surface.
(e) Sanitary protection areas (in hydraulic definition) for planning.
(f) Hydraulic features of well's filter and its vicinity in situ.
And at last, it can be adapted to the remotely monitoring systems of operating wells to obtain the same set of aquifer and well features automatically online.
Benefit for the user.
The new software (when be available) will provide a prompt practical benefit for the user. If he will ask “why this method & software is superior to other available methods?”, the Table 3 below answer this question.
Table 3. Special data the explorer must have/know for
For use the traditional method | For use the proposed method |
Pumping well | Pumping well |
Lithological section | Lithological section |
Observation well | No need |
Hydraulic type of aquifer | No need |
Reservoir type | No need |
Boundary condition | No need |
Homogeneous area | No need |
Long time pumping | Short time pumping |
Budget on pumping well plus | Budget on pumping well only |
This section of the article was missing in a previously in a brief information to whom it was submitted. I wanted the reader himself, of his own free will, having the interest in what he is reading, tried to understand the information and assess it. The response, I think, is a growing number of visitors of my account in LinkedIn. No other responses came. I think the reader expected more details to prove. I have them but it requires article’s volume.
I have mentioned above that at the research's stage the laboratory and workshop investigations were fulfilled. They had a goal to check and verify the base theoretical propositions. This was the research of foundation like for every innovative idea. After that follows field trials in nature condition with the same aim. For those who prefer direct comparison with other methods in a field condition, the disappointment is waiting for him. Hydrogeologic objects are differ from other geological objects due to uncertainty of the geometry and other features. This makes such a path unpromising. Knowledge, experience, and common sense is also a device.
The lab investigations were first. The reference on some results of this part of investigation please look at the end. So, let us give few fragments shortly.
Physical simulation was the preferred method for reaching an independent result, Gershanovich [1981]. The draft can be seen in this book. Such model simulates condition closely matched to a real situation. The investigations included pumping (outlet) with accompanying flowmeter logging along the well screen. Set of piezometers were installed inside the well and in the bed's space. This way the comprehensive monitoring of pressure throughout depression cone was performed.
S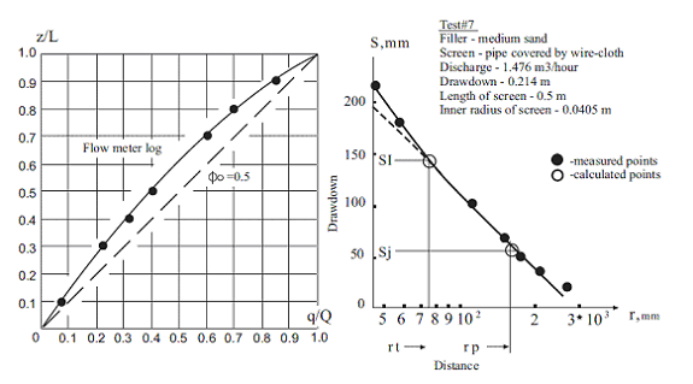
Fig. 7. Example of lab investigation
Figure 7 presents an example where depression cone fragmentation was verified via real measurements, Gershanovich et al. [1986]. A deviation of S=f (Lg ( r ) ) from the straight direction indicates the change of flow regime. Empty points indicate borders between nonlinear, transient, and plane-linear flow. These two points were obtained by theoretical means. It is one of fundamental points of the methodology – depression cone fragmentation hydraulically. And it is OK.
This conclusion is of important. The additional combine field-lab investigation was performed. They included experiments in real wells as a workshop. Real wells had different structure, different methods of drilling. They varied by depth, diameter, and screen type. All wells penetrated heterogeneous and anisotropic aquifers of different sedimentary formations. Field investigations have included pumping accompanied with flowmeter logging. The last method has the goal to provide independent determination of filtration viscosity factor. The technique to calculate this factor through flow meter data was developed separately as the supplementary tool. The use of flowmeter method as a component of pumping well test technology in a frame of the developed methodology is not presupposed.
So, let us discuss this statement.
The basic statement was: a well-aquifer is a self-regulating hydraulic system at the time of pumping. It was proved via comparing of measured and calculated values of depression cone. The actual measurements and calculations have revealed the stability between head losses in different parts of depression cone.

Fig. 8. Comparison between theoretical and real relations St_ versus _ Sl for physical model and real wells.

Fig. 9. Comparison between theoretical relations St_ versus _ Sl for physical model and real wells
Figure 8 and Figure 9 show relationship between St and Sl. First figure depicts the composite of measured data for the model and calculated data for real wells. The second figure presents calculated data only. They were obtained for physical model and real wells by theoretical means. These figures show that obtained distributions are reasonably accurate in approximation by linear regression, despite significant variety of geological conditions and well completion. The coincidence between theory and experiment may be accepted as quite satisfactory. Approximate ratio between St and Sl equals a constant value St=0,5 Sl.
These results confirm the statement the cone of depression is governed by steady laws. The stability of mentioned relations yields the important practical result because reduces the number of unknowns.
The second goal was to find a simple and convenient method of 'filtration viscosity' factor evaluation. Experimental database combined a rather wide variety of sedimentary rocks. After sorting and analyzing of various relations between ‘filtration viscosity’ ![]() and lithological and hydrodynamic characteristics, the standard relation was found. Figure 10 below shows this function. This function
and lithological and hydrodynamic characteristics, the standard relation was found. Figure 10 below shows this function. This function ![]() has no relation to lithology or other deterministic properties. It allows using it as the universal template.
has no relation to lithology or other deterministic properties. It allows using it as the universal template.
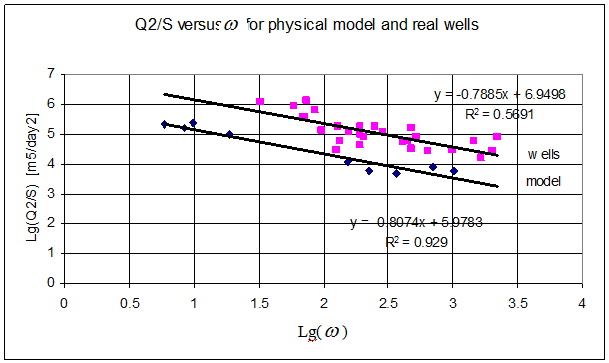 Fig. 10. Experimental data analysis. Integrated collection.
As seen the model and real wells create two separate sets of points. This is a result of scale effect. It is obviously, the size of the lab model does not an infinite extend aquifer. The characteristically feature is that the regression lines for these sets are practically parallel each other. This fact says the value of coefficient for model and real wells have the same nature. The ‘filtration viscosity’ is a hydraulic feature only. For the Fig.10 it was calculated from flow meter log data that accompanied these investigations. In the real case no flow meter measurements accompanying the pumping test or running well. Therefore, there was a need to check the acceptability of these functions for all cases in practice and to find the universal bridge formula. To be sure the following control was fulfilled. The set (30 wells) of random water wells in Israel as used. These wells were drilled by percussion method and screened by gravel pack. Set of these wells differs from previous set of wells. The filtration viscosity was calculated by the found formula that was specially developed for this case. The result you can see at the Fig. 11. The Israeli set marked yellow. The way to obtain the corresponding calculating formula is omitted here as unnecessary in this article. 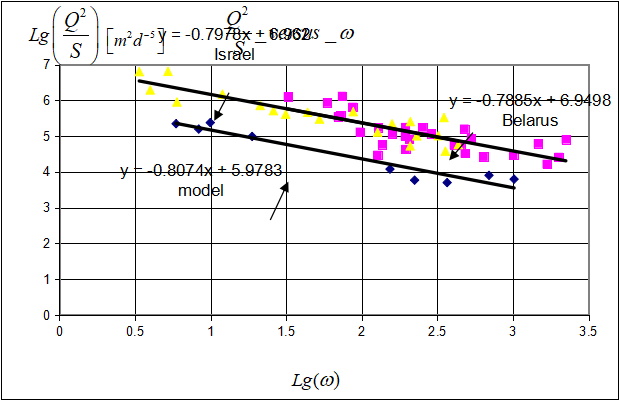
Fig.11. Experimental data analysis. Final approach
Let us go to the field verification
The verification of any research, as preferably, should be done via appraisal of its result. Inner checking of some basic features was successfully fulfilled and showed herein above. But this enough for the researcher. The customer wants more. So that the trust depends on expert's knowledge and his experience. If such customer suddenly wants to check independently, he should take care of test design, accuracy of test data measurement, and specially to care of restrictions. There are many ways to make test wrong but only one to make it correctly. This is my warning to such enthusiastic person. But once more. This does not need at all. About at every well site the expert can find signs to confirm and apprise the reliability of the methodology. Only be with open eyes.
Let us start from one known investigation that was done in the former USSR in the VSEGINGEO (All Union Research Institute of Hydrogeology and Engineering Geology) by (Bissimbaeva K.K. 1976. Thesis, manuscript). This investigation used stochastic analysis to find the relation between assesses of transmissivity that was estimated through data of single wells by use the Theis’ drawdown method and assesses via interference method that used observation wells for the same Theis’ method. This investigation appropriates our goal. This is about the same as transmissivity for elastic and gravitational modes in our definitions. In the mentioned investigation the probable ratio Tj / Tw = 1.33. Recently published investigation by Mathias and Todman [2010] also confirms this statement. The method of depression cone fragmentation, that is discussed herein, yields the ratio Tj / Tw = 1.36 with a squared error close to 1.0. Figure 12 depicts this phenomenon. This is a good confirmation of the theoretical statement.
For wells MeiDan 38 and NahalAmud 1 which follow below herein farther these ratios equal: 1.35 and 1.34 relatively. I find this a good confirmation too.

Fig. 12. Ratio between Tj and Tg (Tw) for the methodology.
The reader who got acquainted with this material up to this page nevertheless has the right to doubt in the result and its reliability in separate cases not in statistic set. Such is the reality.
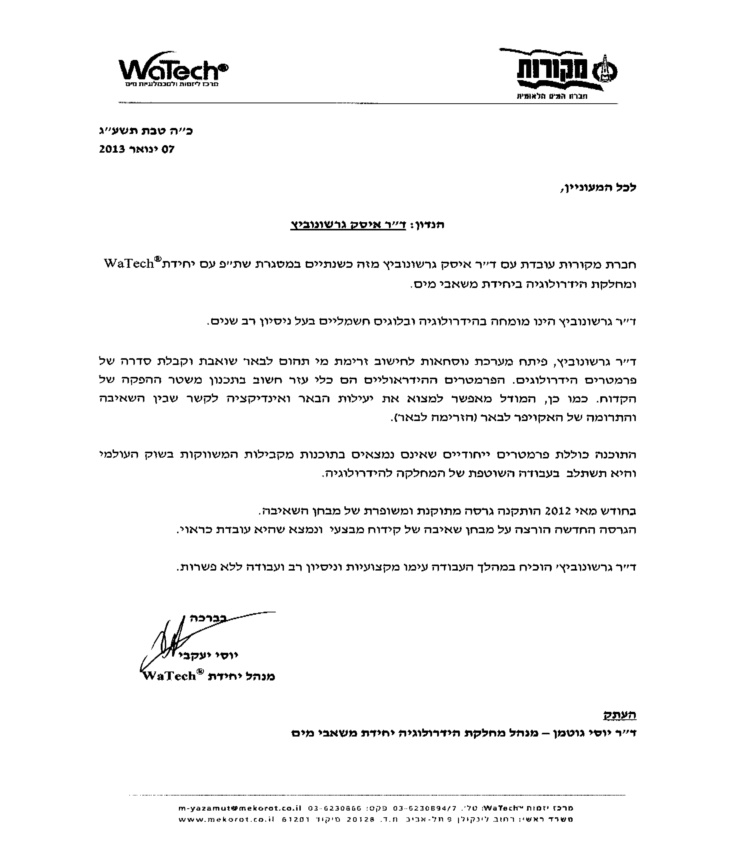
I had already mentioned that at the stage of foundation of this methodology, a pilot version of the software was created which time-to-time changed and expanded. Even now it does not contain a complete list of all definitions that are declared here in above. Since the inception, it had a goal to work out various algorithmic steps in data processing and to verify the accuracy of found formulas. It was and is an instrument for research only. It already needs upgrading as the creative process continues. The last version was transferred to the Water Company of Israel (Mekorot) in 2013 for trial use. After that the research was stopped due the missing of investments. But analytical research was continued as my hobby. Below you can find the endorsement.
Herein below the screenshots of this version are presented and discussed about. Two specific examples are given below. These are typical cases. An expert hydrogeologist will recognize the reliability of the presented facts effortlessly.
For those who prefer direct comparison with other methods in a field condition, the disappointment is waiting for. There are no other objective means except own assess. So, having knowledge, experience and common sense is also a device. This was already claimed herein above, but this worth to repeat once more. In the context of this research, this is the only way.
These two examples present stepwise pumping test. It's like a general case. In general, in the future software it will be not matter, stepwise or constant rate pumping. If any of modes (pumping or recovery) was not recorded, its characteristics are restored virtually. For this case, the appropriate mathematical means have been found. We are considering a closed loop hydrodynamic system. The main thing is to get into it, and it will put everything in its place.
The first example is the MeiDan 38 production well.
Well depth 111.5m. Percussion drilling. Johnson's filter. Pleistocene. Cavernous calcareous sandstones, sometimes there are karst phenomena, and coquina. Sandy loam, loam and clay compose interlayers. The geological and technical section is shown below in Fig. 13.

Fig. 13. The geological and technical section
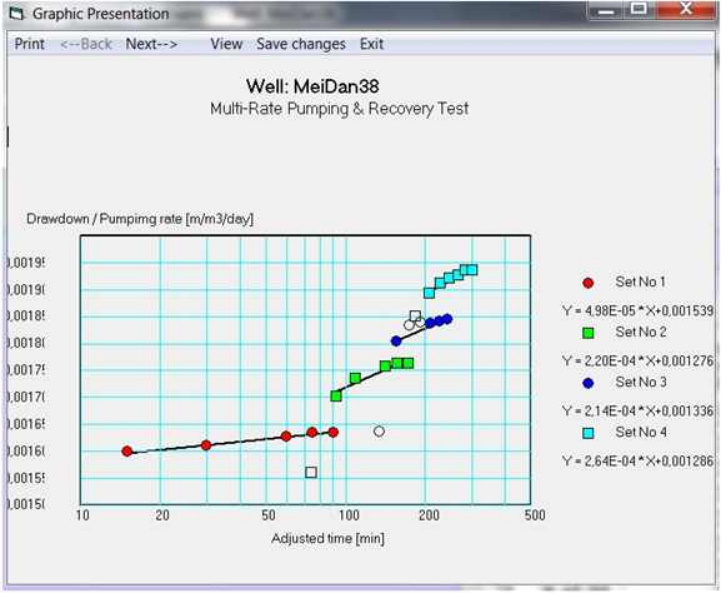
Fig. 14
The report comprises of three parts. They are shown in the screenshots. You may notice that these screenshots have a large time gap. This is done specifically to confirm the history of this software version creation.

Fig. 15. Report. General well data and the test.
For those who prefer direct comparison with other methods in a field condition, the disappointment is waiting for. There are no other objective means except own assess. So, having knowledge, experience and common sense is also a device. This was already claimed herein above, but this worth to repeat once more. In the context of this research, this is the only way.
The second part of the report presents the hydrodynamic properties and characteristics of the aquifer, including determination of its hydraulic type in terms of pressure head and estimates of draining areas which form the inflow into the well. These estimates can be used for designing sanitary protection areas. For example, this aquifer has been identified as unconfined. These data are essentially important in this case. In the contrast to the empirical formulas applied declaratively, their hydraulic identification is proposed here.

Fig. 16. Report Page 2 gives a picture of the hydrodynamic properties and characteristics of the aquifer
The attentive reader probably drew attention to the obvious discrepancy between the high value of water transmissivity and hydraulic conductivity and the extremely low value of effective porosity. Why is it? Experienced expert will be satisfied with a such result because it is an identification of the karst in situ. For more understanding. Karst is like an open pipe. In its presence, small pores get negligibly small load and remain blind. In this case, the average value of effective porosity regarding the thickness of the aquifer appears small. The reader should understand the difference between effective porosity and total porosity. Effective porosity is a dynamic feature of a rock matrix. It depends on applied forces. The total porosity is a natural static property of the rock’s matrix. It doed not dependent on applied forces. These values never equal each other. Total porosity is significantly larger than effective porosity. To find a bridge between them was a problem that excited me many years. But Eureka! After years of being "pregnant with this baby”, I have found the solution. The invention comes by its own time. If you scroll down to the end of this article, you will meet the result. First result while because this child was born only recently. This is a single solution in situ in hydrogeologic history. And in petroleum geology also. I am very proud by myself.
It is worth to pay attention on the following data. The software estimated the thickness of the Water Extraction Formation equals 83.41m. The estimation of the same feature from geological section gives it equals 87.0m plus – minus few meters due to water table changing in time. The value 83.41m was obtained through estimates of other hydrodynamic parameters as transmissivity and diffusivity. So, the accuracy of this methodology can be count as proved.
The following result also confirms high accuracy of the algorithm. These are very close estimates of effective porosity with different sets of initial data. Namely the following initial data were used separately: pumping curve, recovery curve, pumping + recovery, pumping - recovery.
You probably have noticed the strange identification "Quasi-confined" for the Target interval inside the unconfined even phreatic aquifer. To explain and understand the reason, one should once again refer to the lithological section of the well. You will see layers of clay, sandy clay, and sand silty inside and above this interval. We don't know how far they extend in space, but for the duration of the test they block hydraulically the target interval from interacting with water-saturated rocks above this layer. It is probable that with continued pumping, the blocking effect will disappear. That is why the program identifies the target interval as a quasi-confined. Fantastic? No, now this is not a fantastic, but this and much more depends on the quality of the initial data. In this case, they are not very good for the pumping stage. This is visible visually. But the presence of recovery curve made this task easier.
Additional qualitative feature that also identifies this geological formation as greatly hydraulic heterogeneity is a fan-shaped plots. These arguments are well enough to belief this methodology.
The third part of the report Page 3. It is impossible to obtain such data with use known methods.

Fig. 17. The Page 3 of the report is presenting a complete set of hydraulic properties of the filter and near the filter zone.
This result can be used also to verify the methodology. The well was equipped by Jonson's screen. There is a common requirement do not reduce the permeability of the side rocks. The same requirement exists for choosing of drilling method and well completion. Look the result. We have obtained a negative imperfection of the screen, and the value of the filter permeability exceeds the permeability of the side rocks. The same confirms the negative value of the skin factor. Please keep attention on the radius of turbulence. From hydraulic investigations, except of the field of our interest, is known that this value is estimated about two diameters of the screen. We have got it in this limit.
The second example is represented by the NahalAmud 1 productive well.
Well depth 855m. Rotary drilling. Perforated pipe filter. Cretaceous deposits. Dolomites, porous and fractured, with interlayers of chalk and marl.
Below is the geological and technical section.
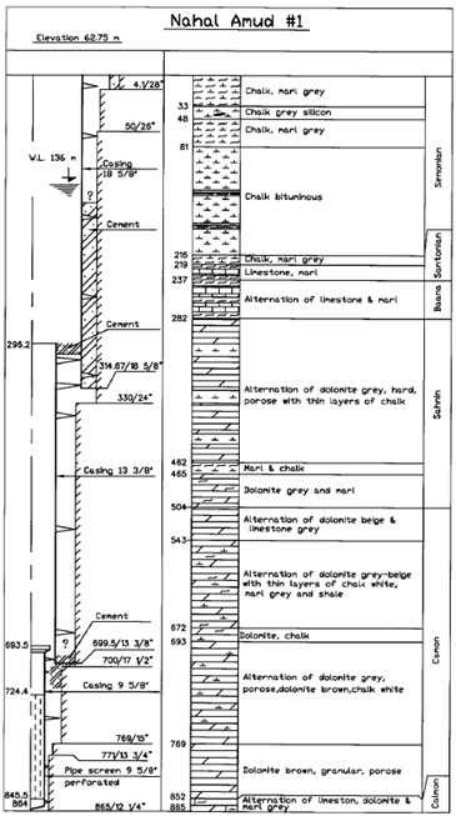
Fig. 18. Geological and technical section of the well

Fig. 19. Episode of processing of primary data: flow rate and dynamics of water level lowering in the well during pumping
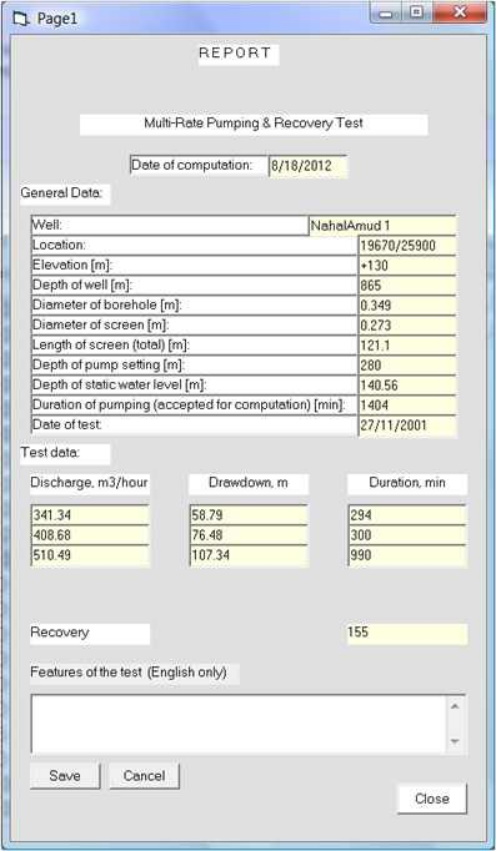
Fig. 20. Page 1. General well data and the test in brief

Fig.21. Report page 2 on the hydrodynamic properties of the aquifer
The aquifer is identified as confined. The hydraulic segments and other characteristics is determined by default in the same way like in all other cases. This determination proves by the following analysis below.
What is worth to notice from this example? First is the thickness of Water Extraction environment that was identified by the software. It equals 169.02m. The geological thickness of this aquifer equals 342.0 m. Why is the difference so large? It is worth to analyze the lithological section more carefully. We see that the lower part of it is presented by clean dolomite of pore and cavernous porosity. This is the established fact here from logging, core data and is a specific feature to the area. Therefore, a filter was installed in this depth interval. Upward in the section the presence of marly and chalk components increases, which significantly reduce the permeability of dolomites. It was reflected in the assessment of the capacity of the Water Extraction Formation. And is an indirect confirmation of the confined type of the aquifer. What is important to insight from this fact? It is that this methodology is OK.
It is worthy to look once more on the set of drawdown functions. They are parallel in contrary to the before going example. This is the understood indicator of homogeneity of the permeable rocks. Accordingly, to this fact the estimated value of effective porosity equals about 8.0%. Remember, the software determines effective porosity, not total porosity. Total porosity is always larger. So, this example verifies the reliability of this methodology also. These first trials were done on the wells MeiDan 38 and NahalAmud 1 have been considered above. Following estimates were obtained.
The well MeiDan 38. For sediments composing the Target interval for water withdrawal the assess of total porosity equals in average – 22.8 % Gross. Separately for sediments composed by sand, calcareous sandstone, and coquina the porosity equals in average - 29.2 % Net. For sediments of mostly clay content like sandy-clay, silt, the value of total porosity equals in average - 17.8 %.
The well NahalAmud 1. The screened interval of the aquifer composed mostly by clean dolomite, porose and cavernous. The smaller part composed by chalky and marly dolomite. Porosity total in average equals 9.9 % Gross. Mostly permeable rocks have the porosity equals in average 20.0 % Net, and mostly impermeable rocks 5.0 %.
These are first trials only! From these trials it is early to make a concluding about accuracy of the method but from the expert’s point of view the obtained estimates of porosity seem quite trusty. This fact gives us the right to claim that the method of porosity estimation (effective and total) is found and created. There are no other methods to compete with him. Few details need to be clarified. For this aim the additional research is desirable to become applicable everywhere at the globe. What is important this research does not need new physical works. There is well enough to use of archive data of tests from the past.
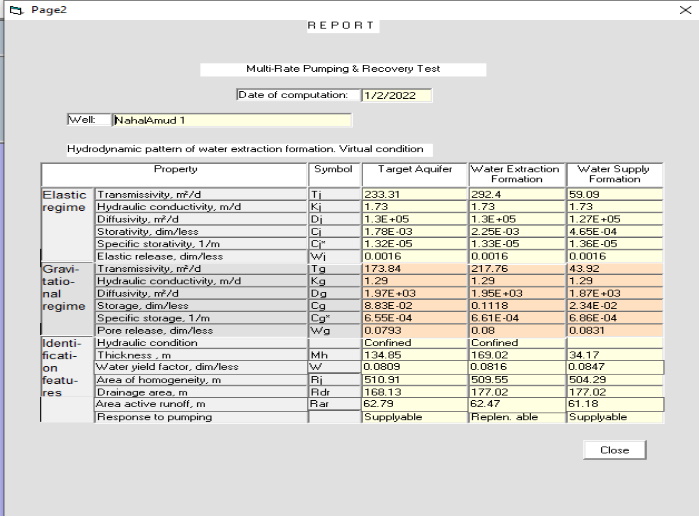
Fig. 22. The Page 3 of the report is presenting a complete set of hydraulic properties of the filter and near the filter zone.
Concerning to the hydraulic features of the well screen and its vicinity the result is like for the previous example. It is confirming the reliability of the presented methodology despite of a large difference between presented examples.
And finally
The author started this science direction in Applied Hydrogeology at the mid of 70-s of the past century in the former USSR and finished completely in Israel with a good result. I greatly thank colleagues of the Water Company of Israel (Mekorot), Water Planning for Israel (TAHAL), and the Israel State Water Service for partially sponsoring and providing field test data (without right to own and authorship). This research has taken a lot of time as any pioneer idea. It is true that the author was a lone conceptualist and the idea developer, but many assistants accompanied him with different works in the former USSR and Israel. The author sincerely thanks them. The chain of steps in solving the scientific problem has taken a complete form: idea - discovery - invention – method. The found set of determinations did the methodology completed. All what you need to know about the water intake site, became known. In science, you can say “it's done”, but you cannot say “it's over”. Few new tasks for science and research continuation arise as the consequence for the next stage. They are in the author's view follows:
It seems the concept of modeling is desirable to be modified. Now it is a virtualization of the object's properties as the reason to the observed effect. And the opposite approach is also possible: the virtualization of the response as the reflection of the natural picture of properties distribution in a space of the object. The combination of these two approaches in one is the path to the reliability of intellectual modeling.
Another problem that seems as an urgent one. It is a parametric monitoring of operating wells equipped by automatic devices for flow rate and water level recording. Any change in the operating mode of the well is accompanied by transient process. This is quite enough to compute the hydraulic state of the wellbore zone and the environment itself on-line.
3. The next step of development an ability of this methodology is an estimation of total (open) porosity of aquifers and oil saturated sediments in situ. First trials were described above. This knowledge can be useful for the design and management of measures for the secondary replenishment of groundwater reserves, a more complete extraction of oil from underground deposits, protection of groundwater from contamination and their purification. Some technologies of underground leaching out of minerals from underground deposits are also the aim.
4. The important application, it seems, is to adapt this research to the oil industry. Several things lead to this conclusion. The found solution for in situ assessment of stratums porosity will allow more complete withdrawal of the mineral. The modern time-consuming well monitoring technologies to maintain their productivity could be simplified also.
5. The developed methodology can be extended on the wells which operate with constant drawdown (fountaining wells). It is mostly wells of thermal water and gas production.
6. So, to extend the foregoing achievement is a natural aim. But for regular use and solve the client's problems we need a user version of the software first.
Afterword
Someone may ask why the author has not published theoretical and other results until now for recognition by the professional community. This is a natural question. But the answer is not that simple. I have been a repatriate in Israel since 1991. I tried to get a position in one of Israeli universities. It was 1991, who remembers the situation. The country was overfilled with newly arrived experts in various fields of science and industry. Thousands of new coming scientists from USSR assaulted the country's universities and industry factories. I was already in age and, to get a grant for my research at the existed level that time, was unlikely. I, as it was expected, received a typical answer: no budget. The state programs to employ such kind of job seekers have appeared few years later. But I already got an employment as freelancer with Tahal and Mekorot. I was at the mercy of the idea to continue the research I had begun fore go. The employment with these companies gave a good opportunity to access available field data. Such thoughts I had that time. And they justified themselves. No one refused helping me. My income as freelancer was small, but my duties did not require daily office visiting. I got freedom to work upon my idea. And I got all the benefits of this existence. So, I did not feel the need to be affiliated to any university along this work. It became desirable at the final stage. But I realized this too late.
All this work was like folding a mosaic panel without a preliminary plan and complete set of elements. How can this be published in parts? When the "panel" (conventionally) was formed, took on its final form, it became oversized. For example, my attempt to publish the theoretical foundations of the method (27 copyright sheets) in parts in the journal "Water Resources Research" ended in failure, not even reaching the peer review. I could not afford to pay for the publication as a whole article. I had no sponsor for payment needed charges. It’s very bad position – independent researcher.
There was other one or two attempts to publish in known peer-reviewed journals. They were also unsuccessful. None of the reviewers criticized the accepted concept or the solution. Russian proverb says: "no bad without good". Such reviews only confirmed my confidence of the chosen path. The editorial decision to refuse publishing was either due to weak English, or mismatching with the format adopted in the journal, and some other editorial remarks with suggestion to fix and come back. But I did not use such opportunity. Publishing is their business. I can’t support it with my pension.
The proposed innovation is unexpected and revolutionary for those who received education under modern programs. The publication of the article in a scientific journal would be useful as endorsement of the novelty. On the other hand. This research is my private enterprise, and its details are currently commercial secrets. Contradictory situation? It is like a knot of Gordian.
My goal was to solve the problem. I have achieved this. To accept the novelty or not to accept is a choice of the customer on the market. To start such business myself is too late for me. Therefore, I’m looking for those who will be ready to establish a startup as his own business.
References
Bear J. (1979) Hydraulics of Groundwater, McGraw-Hill Pub. Co., USA.
Cooper HHJ, Jacob CE (1946) A generalized graphical method for evaluating formation constants and summarizing well-field history. Trans. Am. Geophys. Union v. 27 (4).
Gershanovich IM (1981) Hydrogeological investigations of wells with flowmeter logging, Moscow, Nedra (Rus)
Gershanovich IM, Dydichenko VM, Dydichenko EM (1986) Experimental evaluation of linear flow distortion beyond the screen of pumping well. In Physical modeling of hydrogeological processes. Moscow, VSEGINGEO, p.101-108. (Rus)
Gershanovich Issak (2012) About parametric data for groundwater assessment and hydrogeological forecasts, Electron Scientific Seminar (Rus) http://www.elektron2000.com/gershanovich_0294.html
Gershanovich Isaak (2018) My path and life in hydrogeology, Part 3, Electron Scientific Seminar (Rus) http://www.elektron2000.com/article/2056.html
Mathias SA. and Todman LC. (2010), Step-drawdown tests and the Forchheimer equation, Water Resour. Res., 46.
Petersen GG, Rochwer and Albertson (1953), Effect of well screens on flow into wells. Proc. Am. Soc. Civ. Engrs., 79, n.365, p.1-24.
Sindalovsky LN (2006) Analytical Solutions Handbook for Interpreting Filtration Testing. Publishing house S - Peterburg. University (Rus)
Theis CV (1935) The relation between the lowering of piezometric surface and the rate and duration of discharge of a well using ground-water storage. Trans. Am. Geophys. Union 16th Ann. Meeting, pt. 2.
Walton WC (1983) Selected Analytical Methods for Well and Aquifer Evaluation. Urbana.
Walton WC (1987) Groundwater Pumping Tests – Design and Analysis. Lewis Publishers/NWWA, Chelsea, Michigan


